A Lightweight Prometheus Exporter for Bhyve VMs
3 min readI run a handful of bhyve VMs on FreeBSD, managed by vm-bhyve. Nothing exotic — just a straightforward setup without CBSD, RCTL, or RACCT. I wanted basic visibility into what each VM was doing: is it up, how much CPU is it burning, how much memory is it actually using. The kind of thing you glance at on a Grafana dashboard and move on.
The existing option for this on FreeBSD is rctl_exporter, which instruments FreeBSD’s resource control framework. It’s a solid tool, but it’s designed for a broader use case — RACCT/RCTL accounting across jails, processes, and login classes. If you’re already using RCTL limits and want to monitor those, it makes sense. But if you’re running a simple vm-bhyve setup without RACCT enabled, pulling in the full RCTL machinery just to see if your VMs are alive and how much memory they’re eating is overkill.
So I wrote prometheus-bhyve-exporter.
What it does
The exporter is a small Rust binary that parses the output of vm list (from vm-bhyve) and queries ps for each running VM’s bhyve process. On each Prometheus scrape it collects:
bhyve_vm_up— whether the VM is running (1) or stopped (0)bhyve_vm_cpu_allocated— number of CPUs allocatedbhyve_vm_memory_allocated_bytes— memory allocated in bytesbhyve_vm_cpu_usage_percent— current CPU usage from psbhyve_vm_memory_rss_bytes— resident set sizebhyve_vm_memory_vsz_bytes— virtual memory sizebhyve_vm_pid— PID of the bhyve process
All are gauges. All per-VM metrics carry a vm label with the VM name. There are also bhyve_exporter_scrape_duration_seconds and bhyve_exporter_scrape_errors_total for monitoring the exporter itself.
No kernel modules, no RACCT, no RCTL. Just vm list and ps.
Installation on FreeBSD
You need a Rust toolchain. The repo includes a Makefile and the scaffolding to build a proper FreeBSD package.
From source
git clone https://github.com/ijohanne/prometheus-bhyve-exporter.git
cd prometheus-bhyve-exporter
sudo make install
This drops the binary into /usr/local/bin/ and an rc.d script into /usr/local/etc/rc.d/.
As a FreeBSD package
If you prefer a proper .pkg that shows up in pkg info and can be cleanly removed:
git clone https://github.com/ijohanne/prometheus-bhyve-exporter.git
cd prometheus-bhyve-exporter
make package
sudo pkg add prometheus-bhyve-exporter-0.1.0.pkg
Enable and start the service
sudo sysrc bhyve_exporter_enable=YES
sudo service bhyve_exporter start
The exporter listens on 0.0.0.0:9288 by default. You can override the listen address and the path to the vm command via rc.conf:
sudo sysrc bhyve_exporter_listen_address="127.0.0.1:9288"
sudo sysrc bhyve_exporter_vm_command="/usr/local/sbin/vm"
Scraping with Prometheus
Point Prometheus at it the usual way:
scrape_configs:
  - job_name: bhyve
    static_configs:
      - targets: ['your-freebsd-host:9288']
If you’re managing Prometheus through NixOS (like I am), the equivalent in your scrape config looks like:
{
  job_name = "bhyve";
  honor_labels = true;
  static_configs = [
    {
      targets = [ "your-freebsd-host:9288" ];
      labels = { instance = "your-freebsd-host"; };
    }
  ];
}
Grafana dashboard
The repo includes a Grafana dashboard that you can import directly. It gives you an overview of VM status, CPU usage, and memory consumption at a glance.
Here’s what the CPU and memory panels look like in practice:
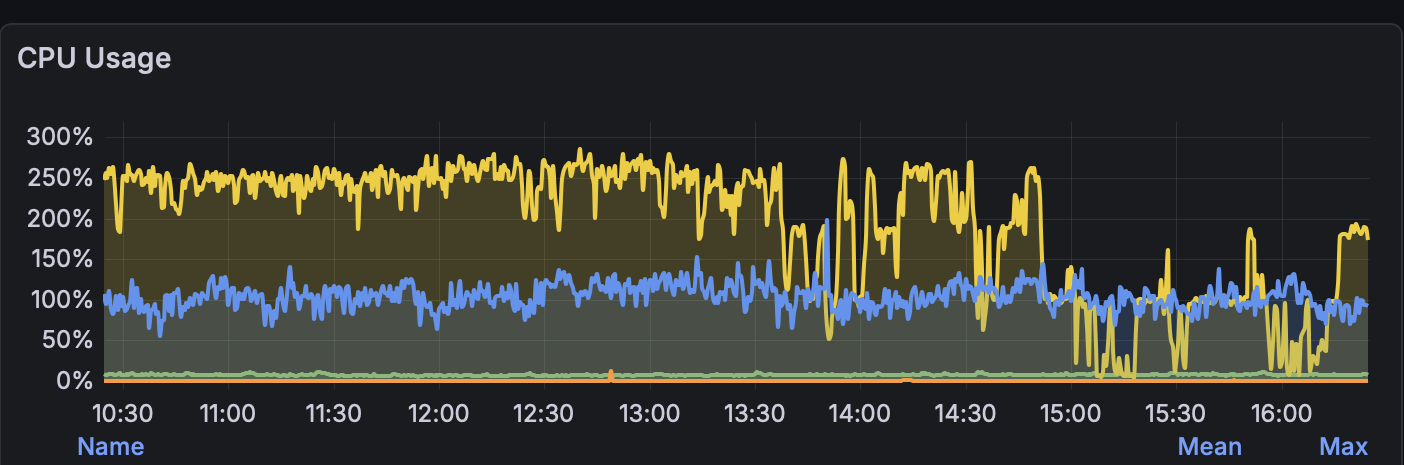
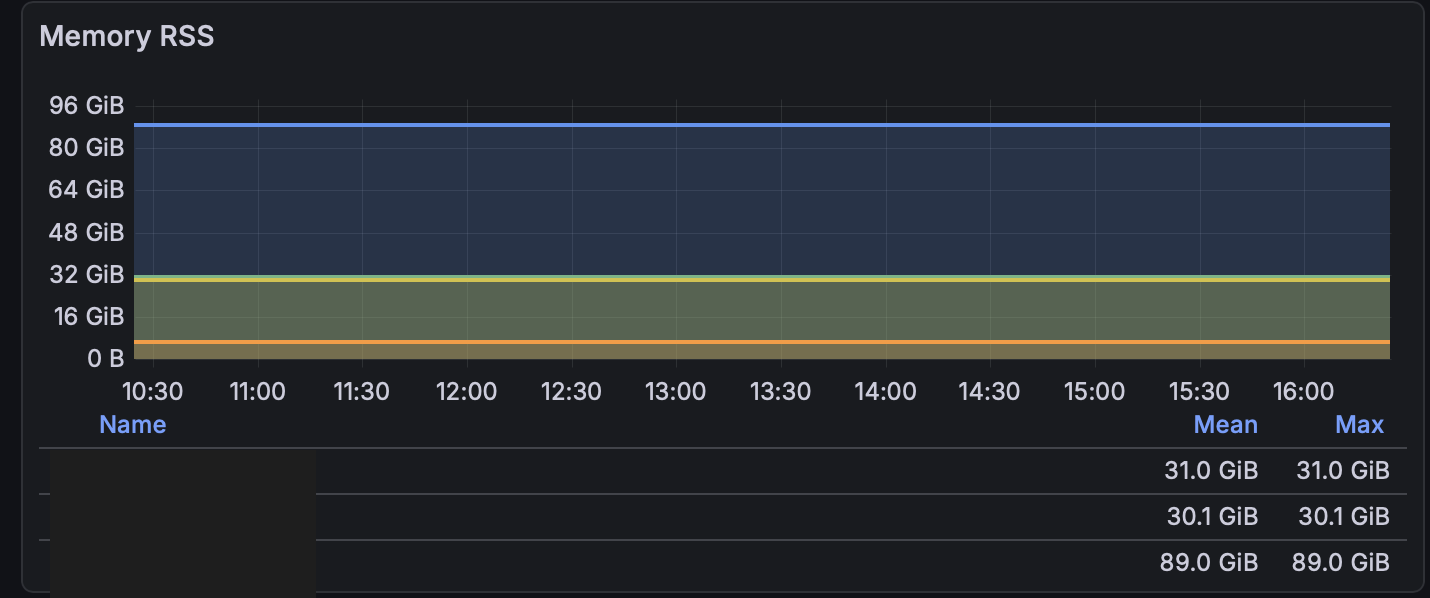
Nothing fancy — just the metrics that matter when you want to know if a VM is misbehaving or if you need to rebalance resources.
Future plans
I’m considering submitting this as a PR to the FreeBSD ports tree once I’ve run it for a while longer and I’m confident it’s stable enough. The port scaffolding is already in the repo, so the jump from “builds locally” to “available in ports” shouldn’t be a large one.
Contributing
The project is MIT licensed and lives at github.com/ijohanne/prometheus-bhyve-exporter. If you run bhyve VMs and want to help make it better — forks and pull requests are very welcome. Whether it’s new metrics, bug fixes, or packaging improvements — all welcome.