Monitoring PostgreSQL on NixOS with pg_exporter
7 min readYou set up services.prometheus.exporters.postgres on your NixOS box. It works. You get a handful of metrics — connection counts, database sizes, a few transaction stats. You wire up a basic Grafana dashboard and call it done.
Then something goes sideways. Autovacuum is running hot, WAL generation is spiking, your cache hit ratio tanked overnight, and the built-in exporter doesn’t have an opinion on any of it. You find yourself writing custom SQL queries, bolting them onto the exporter’s --extend.query-path, managing a YAML file by hand, and wondering if someone has already solved this.
Someone has.
pg_exporter vs postgres_exporter
The prometheus-postgres-exporter in nixpkgs is the community standard. It does the job for basic monitoring. But if you want deep PostgreSQL observability — the kind where you catch problems before they page you — it starts to feel thin.
pg_exporter, from the Pigsty project, ships over 50 collector definitions out of the box. WAL generation rates, checkpoint durations, lock breakdowns by mode, replication lag, sequential scan ratios, dead tuple counts, temp file writes — all pre-configured. Each collector is a standalone YAML file that can be individually enabled or disabled. It supports auto-discovery of all databases on the server. And it handles pgbouncer metrics natively if you run a connection pooler.
The tradeoff is that pg_exporter isn’t in nixpkgs. You need to package it yourself and write a NixOS module. Which turns out to be a good exercise in how NixOS module design makes this kind of thing surprisingly pleasant.
The package
pg_exporter is a Go binary. Packaging it is straightforward with buildGoModule:
pkgs.buildGoModule {
  pname = "pg-exporter";
  version = "1.2.0";
  src = sources.pg-exporter;  # github:pgsty/pg_exporter/v1.2.0
  vendorHash = "sha256-j5RwjJPUDh9AUYqqfvnvcDnGrykRh+6ydbaRsTutO+U=";
  doCheck = false;

  postInstall = ''
    mkdir -p $out/share/pg_exporter
    cp config/*.yml $out/share/pg_exporter/
  '';

  meta = {
    description = "Advanced PostgreSQL & Pgbouncer metrics exporter for Prometheus";
    homepage = "https://github.com/pgsty/pg_exporter";
    license = pkgs.lib.licenses.asl20;
  };
}
The postInstall is the important bit. pg_exporter’s repo has a config/ directory with all 50+ collector YAML files. Each defines queries, metric types, and metadata for a specific area of PostgreSQL internals. The binary reads a config directory at startup and loads every YAML it finds. By copying those into $out/share/pg_exporter/, the module can reference them at build time — no runtime fetching, no mutable state.
Getting it into your flake
You have two paths depending on how you like to consume third-party NixOS packages.
As a NUR package
The package and module live in my NUR repository. Add NUR as a flake input and import the module from nur.repos.ijohanne:
{
  inputs = {
    nixpkgs.url = "github:NixOS/nixpkgs/nixos-unstable";
    nur.url = "github:nix-community/NUR";
  };

  outputs = { nixpkgs, nur, ... }: {
    nixosConfigurations.myhost = nixpkgs.lib.nixosSystem {
      modules = [
        nur.repos.ijohanne.modules.pg-exporter
        {
          services.pg-exporter.enable = true;
        }
      ];
    };
  };
}
NUR handles overlay registration. The NixOS module and the package are both provided by the repo — you just import the module and use it.
As a direct flake input
If you prefer to skip NUR entirely, add the repo as a direct flake input:
{
  inputs = {
    nixpkgs.url = "github:NixOS/nixpkgs/nixos-unstable";
    ijohanne-nur.url = "github:ijohanne/nur-packages";
  };

  outputs = { nixpkgs, ijohanne-nur, ... }: {
    nixosConfigurations.myhost = nixpkgs.lib.nixosSystem {
      modules = [
        ijohanne-nur.nixosModules.pg-exporter
        {
          services.pg-exporter.enable = true;
        }
      ];
    };
  };
}
Note the lack of inputs.nixpkgs.follows — the NUR repo pins its own nixpkgs-unstable because pg_exporter requires Go 1.26, which isn’t available on the stable channel yet. This means it pulls in a separate nixpkgs eval, but that only affects the pg_exporter build closure, not the rest of your system.
Either way, once the module is imported the configuration is identical. The rest of this post assumes the module is available — how it got there is up to you.
The NixOS module
Here’s where it gets interesting. The module needs to do three things: manage collector configuration, run the service, and optionally wire up Grafana and Prometheus.
Options
options.services.pg-exporter = {
  enable = mkEnableOption "pg_exporter PostgreSQL metrics exporter";
  port = mkOption { type = types.port; default = 9630; };
  listenAddress = mkOption { type = types.str; default = "0.0.0.0"; };
  environmentFile = mkOption { type = types.nullOr types.path; default = null; };
  defaultCollectors = mkOption { type = types.bool; default = true; };
  disabledCollectors = mkOption { type = types.listOf types.str; default = [ ]; };
  settings = mkOption { type = settingsFormat.type; default = { }; };
  autoDiscovery = mkOption { type = types.bool; default = false; };
  extraFlags = mkOption { type = types.listOf types.str; default = [ ]; };
  user = mkOption { type = types.nullOr types.str; default = null; };
  enableLocalScraping = mkEnableOption "scraping by local prometheus";
  grafanaDashboard = mkEnableOption "Grafana dashboard provisioning";
};
defaultCollectors controls whether the bundled YAML files ship. disabledCollectors lets you turn off specific ones by name. settings is a freeform Nix attrset that renders to YAML — for custom queries. user lets you run as postgres for socket auth instead of the default DynamicUser.
Config directory assembly
This is the core mechanism. pg_exporter reads all YAML files in its config directory alphabetically and merges them. The module builds this directory at Nix evaluation time:
settingsFormat = pkgs.formats.yaml { };

disabledFile = pkgs.writeText "pg-exporter-disabled.yml" (builtins.toJSON
  (builtins.listToAttrs (map (name: {
    inherit name;
    value = { skip = true; };
  }) cfg.disabledCollectors)));

settingsFile = settingsFormat.generate "pg-exporter-custom.yml" cfg.settings;

configDir = pkgs.runCommand "pg-exporter-config" { } (''
  mkdir -p $out
'' + optionalString cfg.defaultCollectors ''
  cp ${package}/share/pg_exporter/*.yml $out/
'' + optionalString (cfg.disabledCollectors != [ ]) ''
  cp ${disabledFile} $out/9999-disabled.yml
'' + optionalString (cfg.settings != { }) ''
  cp ${settingsFile} $out/9999-custom.yml
'');
Three layers:
- Default collectors — copies the 50+ bundled YAMLs from the package
- Disabled collectors — generates a
9999-disabled.ymlwithskip: trueentries - Custom settings — renders your Nix attrset to
9999-custom.ymlviapkgs.formats.yaml
The 9999- prefix ensures overrides load last. pg_exporter processes files alphabetically, so a later file wins. This is the same pattern you’d use with systemd drop-in directories — convention over configuration.
The systemd service
systemd.services.pg-exporter = {
  description = "pg_exporter PostgreSQL metrics exporter";
  wantedBy = [ "multi-user.target" ];
  after = [ "network.target" "postgresql.service" ];
  serviceConfig = {
    Restart = "always";
    ProtectHome = true;
    PrivateTmp = true;
    NoNewPrivileges = true;
  } // (if cfg.user != null then {
    User = cfg.user;
  } else {
    DynamicUser = true;
    ProtectSystem = "strict";
  }) // {
    ExecStart = concatStringsSep " " ([
      "\${getBin package}/bin/pg_exporter"
      "--config=\${configDir}"
      "--web.listen-address=\${cfg.listenAddress}:\${toString cfg.port}"
    ]
    ++ optional cfg.autoDiscovery "--auto-discovery"
    ++ cfg.extraFlags);
  } // optionalAttrs (cfg.environmentFile != null) {
    EnvironmentFile = cfg.environmentFile;
  };
};
When user is null, the service uses DynamicUser with strict system protection — no writable paths, no privilege escalation. If you set user = "postgres", it drops DynamicUser and ProtectSystem so it can use the postgres Unix socket for authentication. This avoids needing a password in the environment file entirely.
One-toggle Grafana and Prometheus
The last piece is integration wiring:
# Grafana dashboard provisioning
services.grafana.provision.dashboards.settings.providers =
  mkIf cfg.grafanaDashboard [{
    name = "pg-exporter";
    options.path = pkgs.runCommand "pg-exporter-dashboards" { } ''
      mkdir -p $out
      cp ${./dashboard.json} $out/postgres.json
    '';
  }];

# Prometheus scrape config
services.prometheus.scrapeConfigs = mkIf cfg.enableLocalScraping [{
  job_name = "postgres";
  honor_labels = true;
  static_configs = [{
    targets = [ "127.0.0.1:\${toString cfg.port}" ];
  }];
}];
grafanaDashboard = true provisions a dashboard JSON into Grafana’s filesystem provisioning. enableLocalScraping = true adds a Prometheus scrape target pointing at localhost. Both are mkIf-guarded — if you don’t flip the toggle, they produce no configuration.
Nix-to-YAML custom collectors
The settings option is where pkgs.formats.yaml shines. You define custom queries in Nix and they render to valid YAML without you ever touching a YAML file:
services.pg-exporter.settings = {
  my_custom_query = {
    query = "SELECT count(*) as total_users FROM users";
    metrics = [
      {
        total_users = {
          usage = "GAUGE";
          description = "Total number of users";
        };
      }
    ];
    ttl = 60;
    tags = [ "custom" ];
  };
};
Full Nix type checking. No YAML quoting issues. No hand-managing a sidecar file. The Nix module system validates the structure at evaluation time — if you fat-finger a field name, you get an error before the config ever reaches the exporter.
The dashboard
The bundled Grafana dashboard covers the metrics that actually matter for day-to-day PostgreSQL operations.
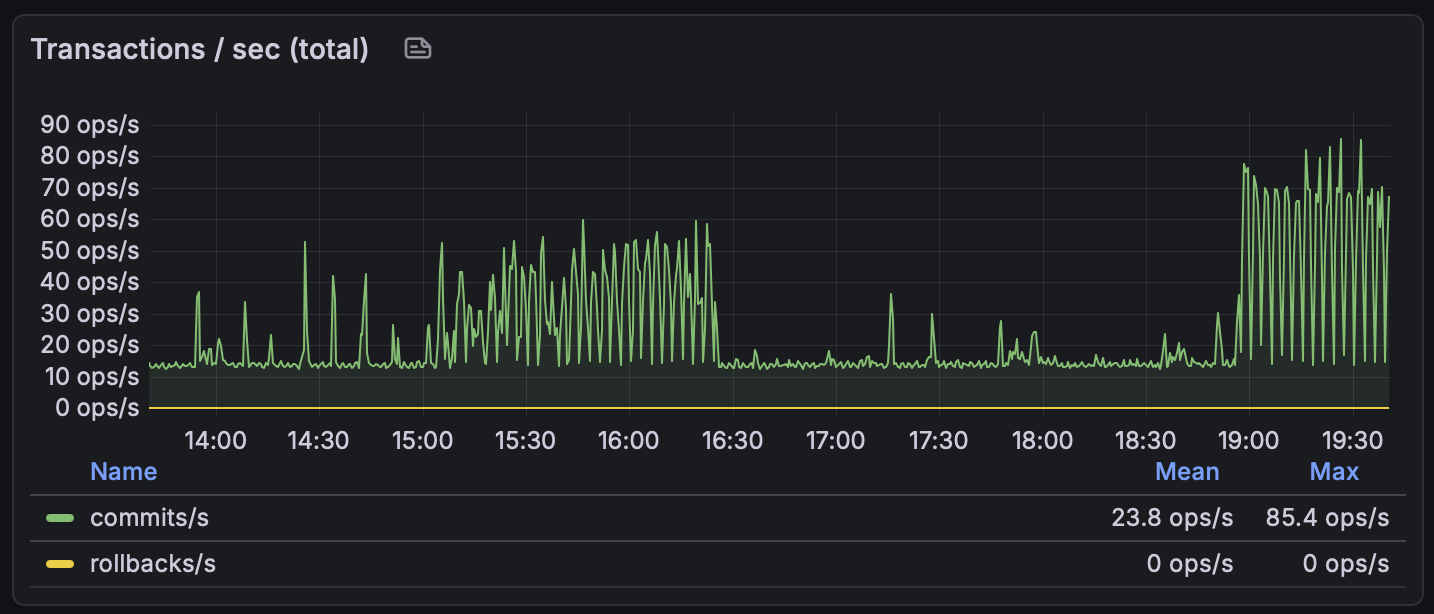
Transactions per second — commits and rollbacks, total across all databases. Zero rollbacks is what you want to see:
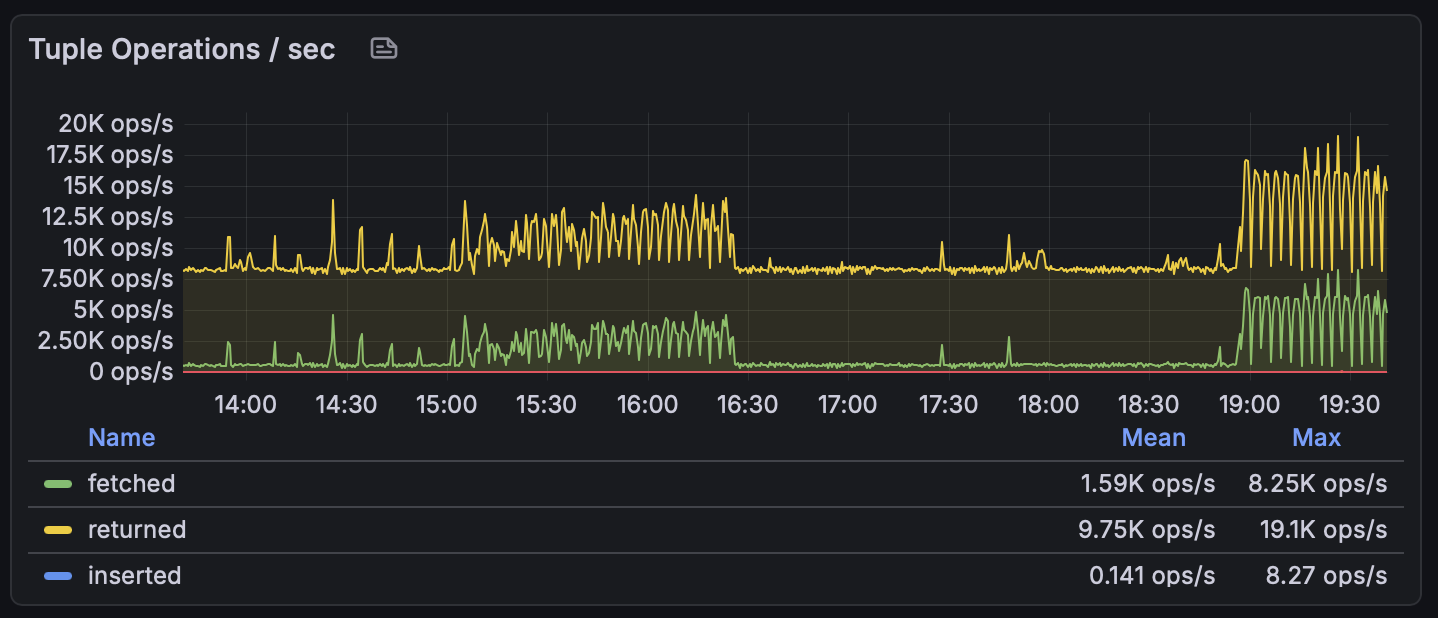
Tuple operations give you the read/write breakdown. The “returned” line is what PostgreSQL scanned; “fetched” is what it actually sent back to the client. A large gap between the two means sequential scans are doing a lot of wasted work:
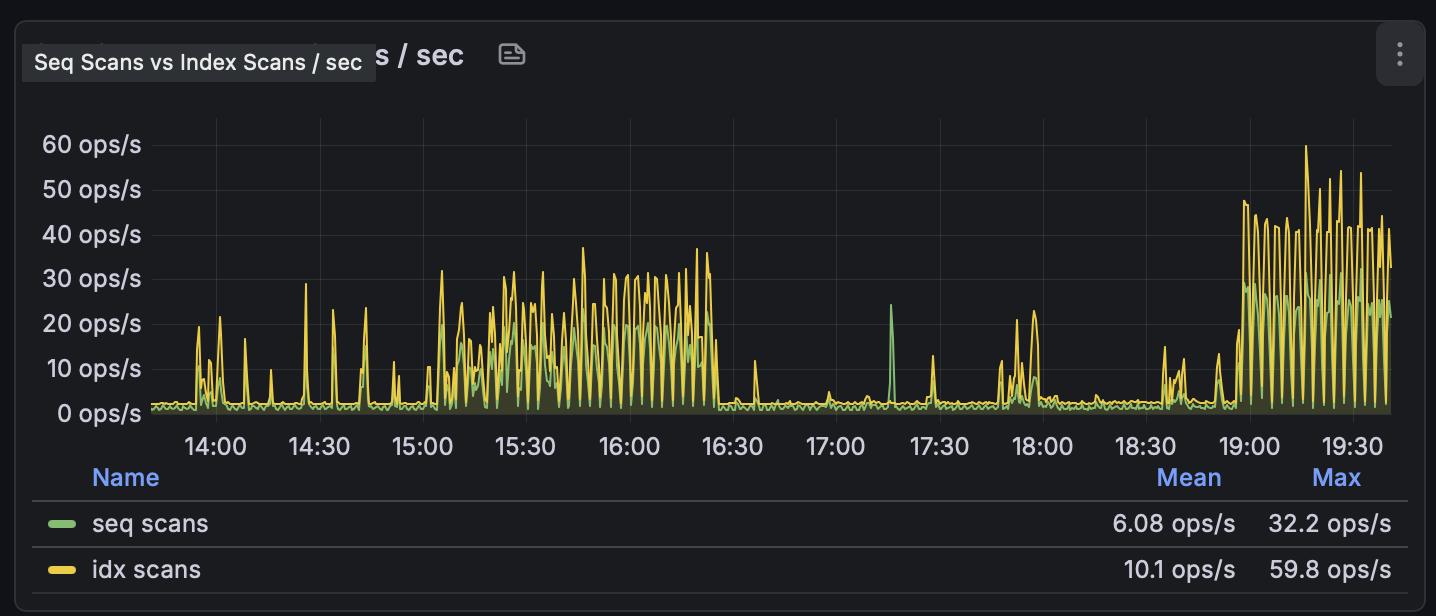
Sequential scans vs index scans. You want the yellow line (index scans) to dominate. When sequential scans spike, either a query plan changed or you’re missing an index:
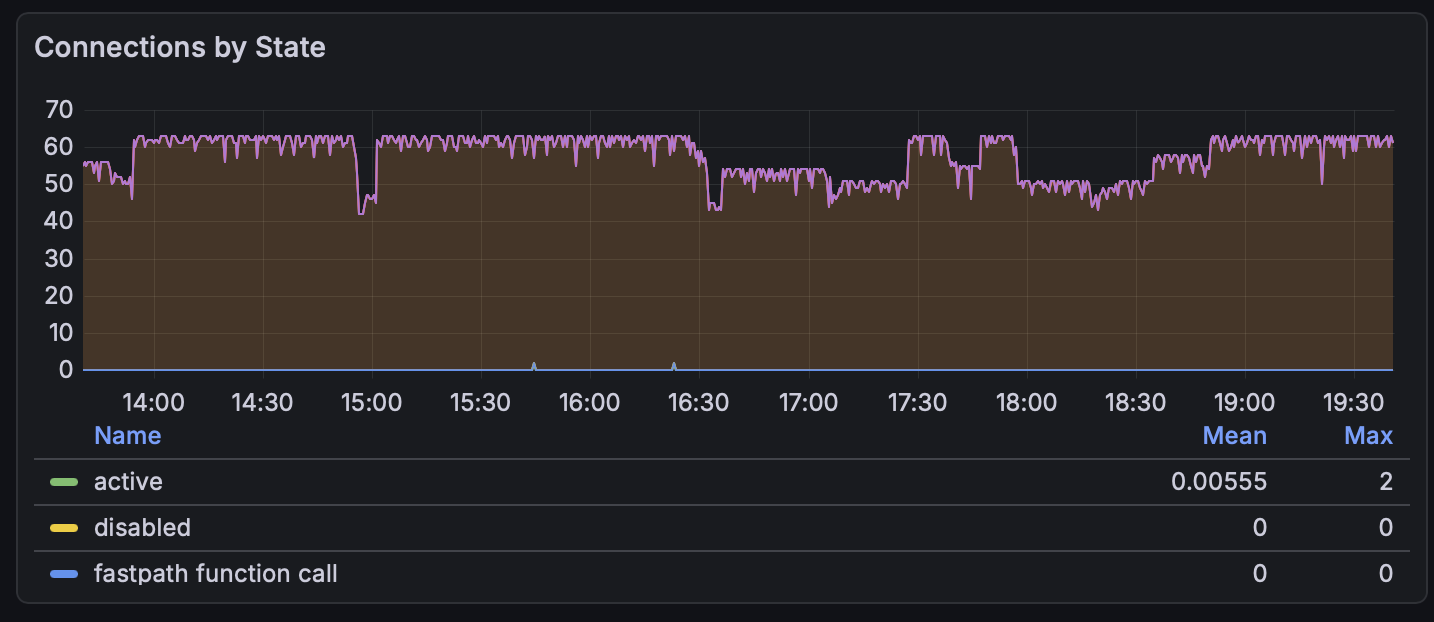
Connections by state shows your connection pool saturation at a glance. The idle connections (the filled area) sitting around 50–60 is typical for a pooled setup:
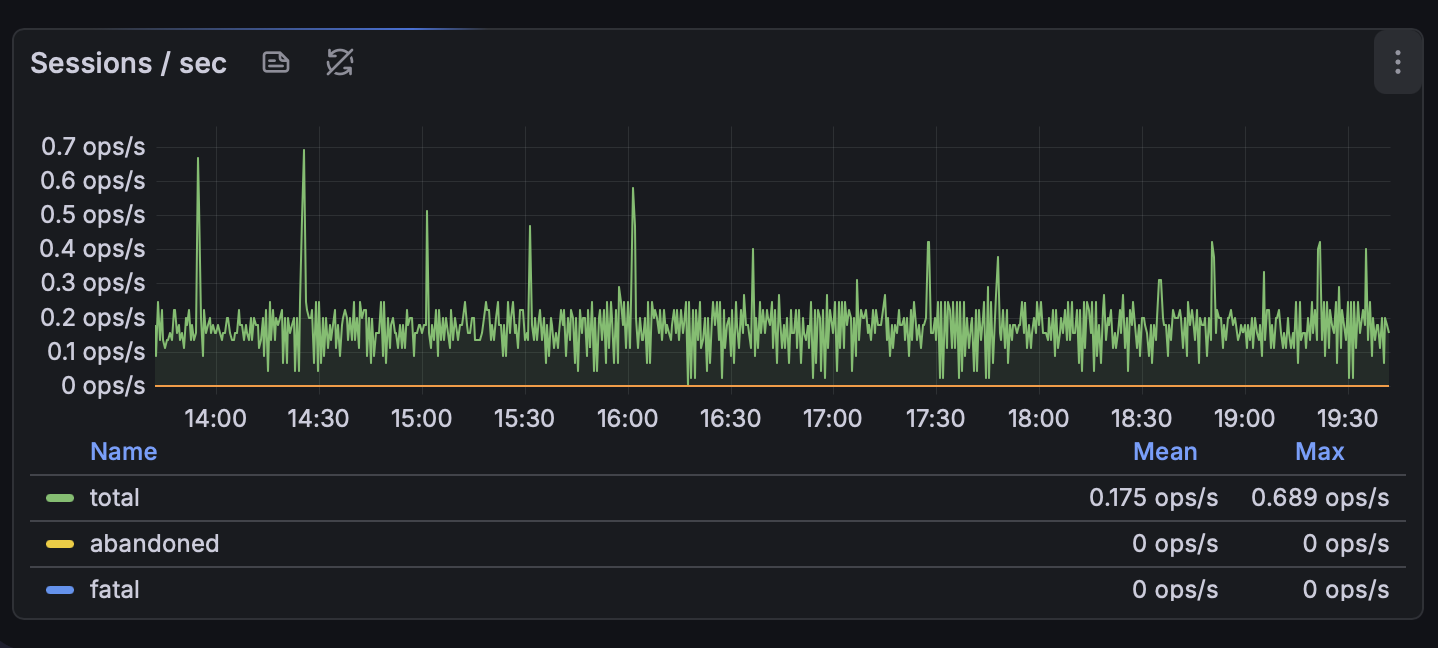
Sessions per second tracks session creation rate. Flat and low is healthy — spikes mean something is churning connections:
All of these panels — plus cache hit ratios, WAL generation rates, checkpoint durations, lock breakdowns, autovacuum activity, database sizes, and temp file writes — ship with a single toggle.
Putting it together
A minimal production config:
services.pg-exporter = {
  enable = true;
  environmentFile = config.sops.secrets.pg-exporter-env.path;
  grafanaDashboard = true;
  enableLocalScraping = true;
};
The environment file — managed by sops-nix or agenix or however you handle secrets — contains the connection string:
PG_EXPORTER_URL=postgresql://pg_exporter:password@localhost:5432/postgres?sslmode=disable
If you want socket auth and fine-grained control over collectors:
services.pg-exporter = {
  enable = true;
  autoDiscovery = true;
  user = "postgres";
  environmentFile = config.sops.secrets.pg-exporter-env.path;

  disabledCollectors = [
    "pgbouncer_list"
    "pgbouncer_database"
    "pgbouncer_stat"
    "pgbouncer_pool"
    "pg_tsdb_hypertable"
    "pg_citus"
    "pg_recv"
    "pg_sub"
    "pg_origin"
    "pg_pubrel"
    "pg_subrel"
    "pg_sync_standby"
    "pg_downstream"
    "pg_heartbeat"
  ];

  grafanaDashboard = true;
  enableLocalScraping = true;
};
The disabledCollectors list is where you prune what you don’t need. No pgbouncer? Disable those four. No TimescaleDB or Citus? Gone. No replication? Drop the replication collectors. The exporter won’t waste time querying for metrics that don’t apply to your setup.
The NixOS module pattern
This is the same pattern every time: a Go binary gets buildGoModule, its config files land in $out/share/, the module assembles a config directory from Nix expressions, and integration options (grafanaDashboard, enableLocalScraping) wire into other NixOS services with mkIf. The systemd service uses DynamicUser for least-privilege. Secrets stay in environment files, never in the Nix store.
If you’re packaging any Prometheus exporter for NixOS, this is the template. The specific queries and YAML files change. The module structure doesn’t.